Kaltura - Analytics
Kaltura has great analytics to help you better understand how students are watching the media you have published through Kaltura. You can view details about a single video or a summary of all of the Kaltura media added to a specific course. Details include:
• who has watched your media (you can even see if it was on a mobile device or computer!)
• how long they watched your media
• which media is most popular
Viewing Analytics for a Kaltura Video:
1. Go to the Media Gallery. If you don't see the Media Gallery, add it to your Canvas course by going to Settings and selecting Navigation.
Note: When you enable the Media Gallery in your Canvas course, your students will be able to view it as well. However, only media you specifically add or approve visible in the Media Gallery.
2. In the upper right, from the Actions dropdown menu, select Analytics.
3. Filter the analytics based on what you want to see.
Analytics Features
For all Kaltura media in the Canvas course or MediaSpace channel you are in, highlights show:
Total number of player impressions, which is the number of times someone opened a web page where the media appears
• Minutes viewed
• Number of plays
• Number of contributors
• Unique views
Filters available
There are a number of additional filters available to view in Kaltura.
To use filters, select the Filter menu.
• In analytics for a single video, you can filter by:
• Country
• Domain; kaf.canvas.wsc.edu is Kaltura in Canvas
• In analytics for a Canvas course or MediaSpace channel, you can filter by:
• Media Type: whether the media is video, audio, and/or images
• Entry Source: whether the media was uploaded from the owner's computer/device, Kaltura Capture, or Kaltura Classroom
• Viewing Context: means to show data about a video everywhere it may be published, including the Canvas course or MediaSpace channel. Select Sub Category to view only media embedded on a page or other resource using the Rich Content Editor in Canvas.
• Tags: specific tags you may have entered for the media
• Domain: kaf.canvas.wsc.edu is Kaltura in Canvas
• Location: Includes Country, Region, and City
To explore engagement trends over time, use the graph to review key metrics in the additional tabs within Category (or Video) Performance Over Time:
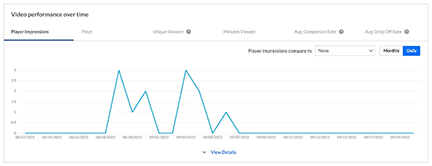
• Plays: Number of times users select play to watch a video
• Unique viewers: Number of authenticated viewers; all anonymous viewers count as a single viewer, labeled "Unknown"
• Minutes viewed: Total duration of video watched by viewers
• Avg. drop off rate: An average measured by viewers reaching playback milestones
• 25% play-through: The number of plays that reached 25% of the video
• 50% play-through: The number of plays that reached 50% of the video
• 75% play-through: The number of plays that reached 75% of the video
• 100% play-through: The number of plays that reached 100% of the video
Note: Many viewers will watch all video content but do not count as 100% completion due to "dead air" at the end of the video.
• Avg. Completion Rate: The percentage of completed plays. The number of 100% play-throughs divided by the total number of plays
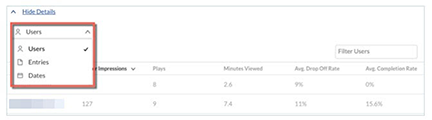
Selecting View Details at the bottom of the Performance Over Time section provides additional filtering options. You can sort by Users, Entries, and Dates.
Last Updated: 9/22/22